
Data Analysis
Welcome to the ultimate data machine.
Construct custom datasets from hundreds of advanced stats and metrics.
Harness the most powerful database of advanced statistics and analyze within minutes. Query NFL data going back to 2013 that includes: Quarterback (QB), Running Back (RB), Wide Receiver (WR), Tight End (TE), Offensive Line (OL), Defensive Line (DL), EDGE, Lineback (LB), Cornerback (CB), and Safety (S).
Prospect Profile Metrics

Data Analysis features popular college metrics such as Breakout Age, Dominator Rating, Speed Score, and includes all metrics outlined in PlayerProfiler’s Terms Glossary. Utilize a player’s Throw Velocity, Catch Radius, SPARQ-x Score, or any of the other prospect profile metrics to conduct in-depth research, and better understand how well these different tests correlate with future success in the NFL. With the Data Analysis tool, you can access the underlying source values of workout metrics like Burst Score and Agility Score by querying our database for vertical jump, broad jump, shuttle drill, and 3-cone test results.
Research Ideas
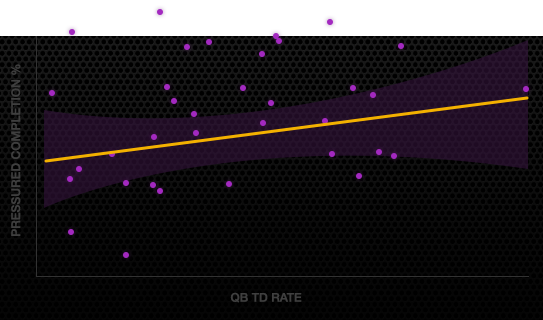
Which players have the largest disparity between speed score and agility score (3-cone drill + 20-yard short shuttle), and how are their NFL careers going? D.K. Metcalf has the most lopsided Speed Score percentile compared to Agility Score percentile. Who are some players on the opposite end, that have elite Agility Scores, yet underwhelming Speed Scores? What is the average fantasy point production for RBs vs. WRs that have a large discrepancy between these metrics? How strong is the relationship between a quarterback’s Throw Velocity as a prospect, and their Deep Ball Completion Percentage in the NFL?
Efficiency Metrics
Opportunity is important, but efficiency helps players continue to see high opportunity shares and target shares. The Data Analysis tool gives you access to yards per route run, play-action completion percentage, catchable target rate, and much, much more. Properly understanding and accounting for efficiency in your analysis is critical, as NFL teams are finally growing less tolerant toward inefficient players.
Research Ideas
Which position has more stable efficiency from year-to-year, running back or wide receiver? Are the most efficient WRs in a given season likely to repeat that efficiency the year after or year prior? How about RBs?
Hint: To conduct research comparing positions using the Data Analysis tool, simply create and download a RB dataset with all necessary efficiency metrics, then create and download a WR dataset with all the needed metrics. The best fantasy analysis generally isn’t grouping multiple positions together, but rather analyzing how players within a position group measure up to each other.
Advanced Metrics
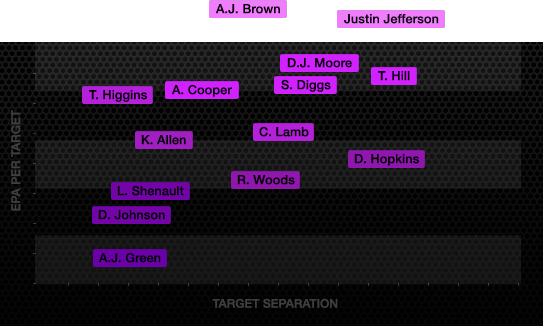
Data Analysis provides exclusive access to metrics that are not available on PlayerProfiler’s player pages. Use our tool to find gems like slot fantasy points per target, EPA per target, targets within 5 yards of the end zone, carries inside the 10, carries inside the 5, etc. These advanced metrics are what take a “good” research project and make it “great.”
If you’re curious about EPA (expected points added), and want to understand how to leverage a traditional “football analytics” stat like this in fantasy football, check out this primer on EPA.
Research Ideas
Which players have the largest discrepancy between VOS and EPA, ie the players that are really strong in fantasy, but terrible in real life, or vice versa? Which positions generally have the higher cumulative EPA, and is there any statistical backing to the phrase that “running backs don’t matter?”
Opportunity Metrics
Opportunity matters in the NFL, especially for a position like RB. It’s great for a player to be efficient when on the field, but step one is getting on the field to begin with. High-quality research should always factor in the opportunities that players earn, or are thrust into due to injury. Take advantage of player snap shares, targets, carries, deep ball pass attempts per game, and much more.
Weighed Opportunities, for example, is a key metric to analyze. Since not all RB touches are created equally. The value of a RB target is far greater in fantasy football than the value of a generic RB carry, and weighted opportunities accounts for this.
Research Ideas
Which TEs have the highest slot rates in the NFL? Is there a strong correlation between TEs lining up in the slot and TEs that produce fantasy points?
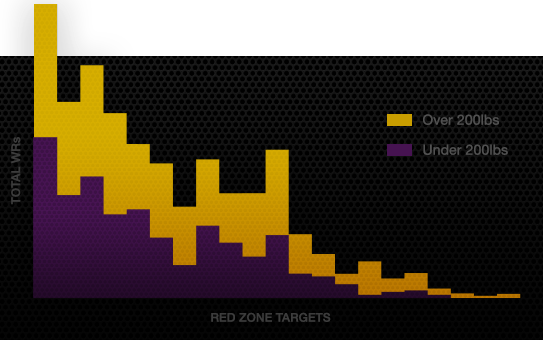
Among all RBs with 10+ carries a game, which guys have the highest percentage of their touches come in the red zone? Recommended metrics to include in your Data Analysis export would include red zone touches, red zone carries, total carries, total TDs, team run plays per game, player weight, and speed score.
Which WRs have been in the top 5 each season in unrealized air yards, and how did they perform the following season?
Fantasy Metrics
Now it’s getting really interesting. Beyond a player’s prospect profile and advanced NFL performance data, we then transform the data set into fantasy point output. Data Analysis provides access to a suite of proprietary metrics to better understand player value across fantasy football league formats.
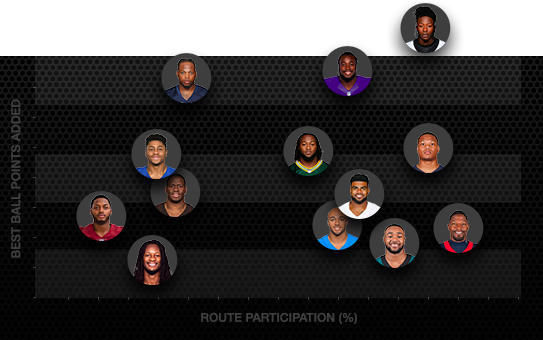
Interested in improving your best ball strategy and analysis? May we interest you in our new Best Ball Points Added metric, which accounts for only the fantasy points from each player that are actually counting for you each week. In best ball, a donut (0 points) can be forgiven when that player gives you 30 fantasy points the next week, while in redraft, that 0 point performance likely cost you a win.
Another fantasy-specific metric that you’ll have full access to is Value Over Stream (VOS), which captures how many weekly fantasy points above/below your likely bench QB/RB/WR/TE that a player scores.
Research Ideas
Is opportunity or efficiency more important in predicting a guy’s VOS, for both RBs, WRs, and TEs? Which position(s) is more opportunity-based year after year, and which position(s) is more dependent on efficiency when trying to estimate what a guy’s VOS will be?
Utilize our 1-click download process to view your new, custom dataset in Excel, R, Python, or any of the other popular analysis tools.